Posts

Six Sigma Virtual Catapult with Excel

Image
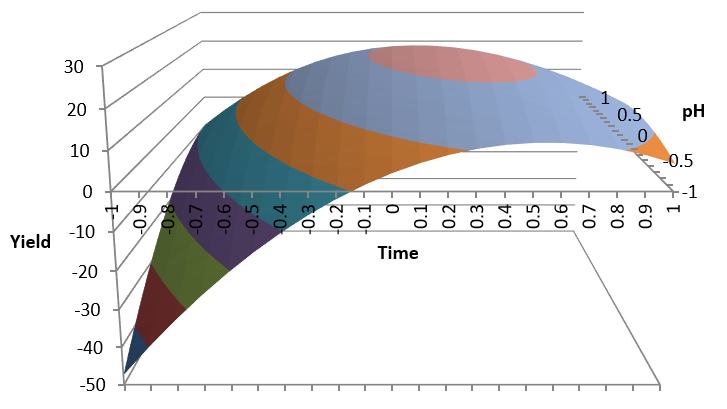
  A wooden catapult has been widely used in Six Sigma education to illustrate multiple factor process variation and optimization. We will use a catapult simulator with 4 factors to practice: Process variation Linear regression Response surface analysis Process optimization This will be done using Microsoft Excel Analysis and Solver Download this Excel simulator Catapult.xlsx from Google Drive and run it in your PC. Select sheet Catapult Working Plan 1. What factors affect distance? 2. What values of these factors to achieve maximum distance? 3. Run a full factorial set of experiments with 4 central points 4. Can you detect curvature? Is this linear model valid? 5. Run response surface experiments to find a better model 6. What is the resulting formula to estimate distance as a function of factors? 7. What values give us the maximum distance? 8. Make 10 replicates to estimate the confidence interval of the distance 9. Calculate the angle a to hit a target of 20 with ma...

Statistical Process Control with Excel

Image
  Statistical Process Control (SPC) is used to control a critical process output, acting on the factors affecting it, only when required. The purpose is to differentiate between a statistically significant change in the process, and common cause variation, because the actions required will be different. Process stability is a prerequisite for any further analysis. If a process is not stable, any conclusions you draw, can't be assumed to hold in the future. With SPC we check for process stability in the future. Control over-reaction A case of over-reaction is illustrated by the following example: Someone is shooting at a target, and based on the deviation of the impacts, he adjusts the gun site after each shot. The result will be an increase of the dispersion of the impacts; therefore, the adjustments will make the process worse. The correct way is, of course, to fire 5 or 6 shots without adjustments, and then decide if adjustment is required, based on the center of the impacts. ...

Excel VSM Simulator

Image
    A still picture of a Value Stream Map may not fully explain the behavior of the Value Stream. In some cases we need to understand its dynamic behavior. To do this we will convert our Excel Value Stream Map into a Monte Carlo Simulator. In Excel Value Stream Map we saw how a complex Value Stream could be mapped using Excel. We saw the importance of mapping feedback loops such as test-repair loops because they may become the bottleneck for the complete value stream. In this situation not all items flow along all branches so we need to calculate the % flowing along each branch. This enabled us to calculate the cycle for each workstation based on the staffing. Finally we were able to calculate the ideal staffing to balance the line: insure no workstation cycle is above the average inter-arrival time (takt time). This we did using Solver. Value Stream Map: Still Picture Vs Dynamic Behavior Mapping the current value stream is a good starting point to understand how it behaves b...