Process Control and Capability
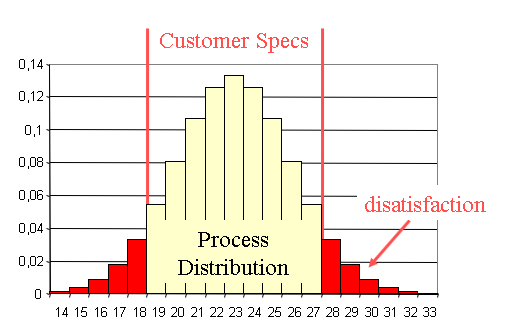
Process Stability Vs Capability Stability means a process is behaving in a predictable way but it doesn't necessarily mean it meets the customer expectations. Process capability measures to what extent it is able to satisfy the customer requirements. The first step for process improvement is to achieve stability. We analyse this with Statistical Process Control . As a result of this analysis we may find out-of-control situations due to special causes. In this case we need to resolve these causes to make the process stable. Once the process is stable, we can find out to what extent is it able to meet customer expectations. This is done by measuring Process Capability . Descriptive Statistics with Excel Download a copy of Excel file Capability.xlsx from OneDrive on to your PC to run it. In sheet Diameter in column A we have 500 measurements of a critical diameter. After being confident that our process is stable we can character...
