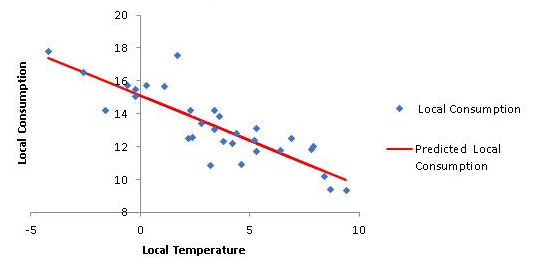
Random Variation Vs Trends
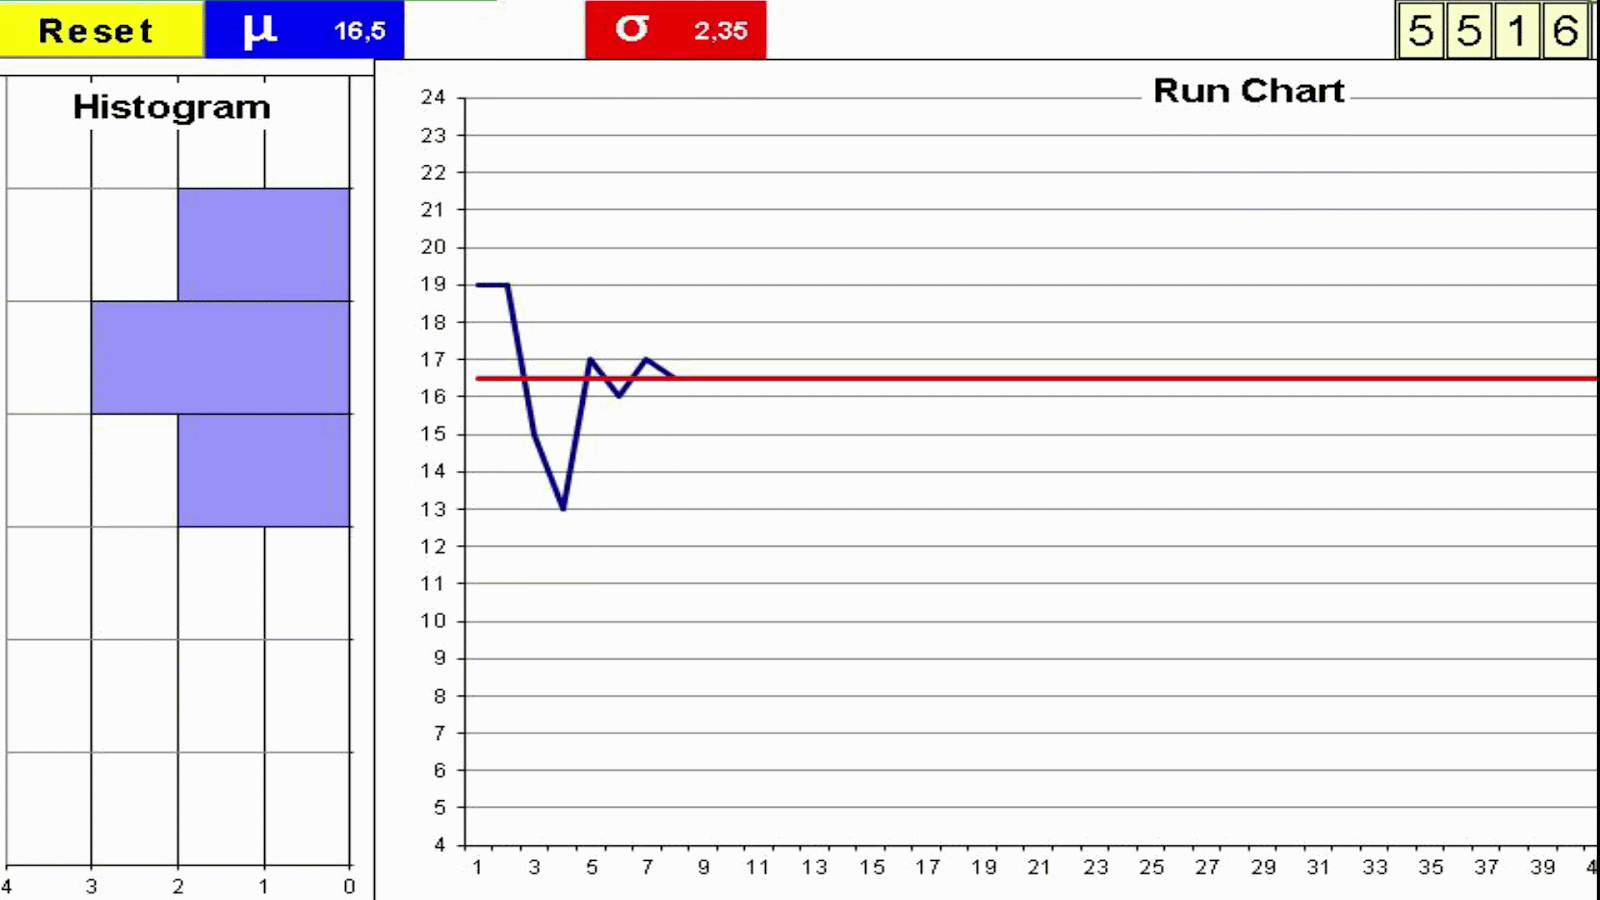
Understanding variation is key to interpret the value stream behavior. Not all variation is the same. Variation These are some factors which may add variation to the process of cooking a turkey. Every process has variation. Some causes of variation may be identified and acted upon. We can use two metrics for variation which complement each other: Manual Dice Throwing This simple exercise can help to experience process variation and understand the difference between a process change and inherent process variation. This understanding is key on management decisions to avoid both overreaction and lack of reaction. To run the exercise with actual dice print the form: Exercise: You will need a printed form and 4 dice for each team Throw 4 dice and add the outcomes Record the result in the Run Chart Repeat 50 times Join the dots in the Run Chart with a line Build the Histogram by counting the total number of dots on each group of 3 values Run this Exercise with a Simulator Downloa...