Posts

Showing posts with the label DOE

Multiple Response Optimization with Design of Experiments (DOE)

Image
  Design of experiments, is a systematic experimentation, with a process critical factors, in order to correlate these factors to process responses. In DOE with Excel we obtained a linear relationship, between several factors and one response.  In Response Surface DOE  this was extended to non-linear relations. In both cases we were optimizing one single response. Now we will analyse some cases where more than one response needs to be optimized. Problem Description Download file Multiple Response.xlsm from OneDrive to your PC. We want to maximize yield and minimize cost in a process where we have identified three critical factors which may affect both. These are the factors and levels we want to experiment with: Full Factorial DOE We start with a full factorial with two central points DOE and run a simulation of the experiments in sheet YieldCost Simul  we then add the interaction columns (green headers) for the analysis: We now use Excel Data Analysis > Regression to analyse Y

Response Surface Design Of Experiments with Excel
Image
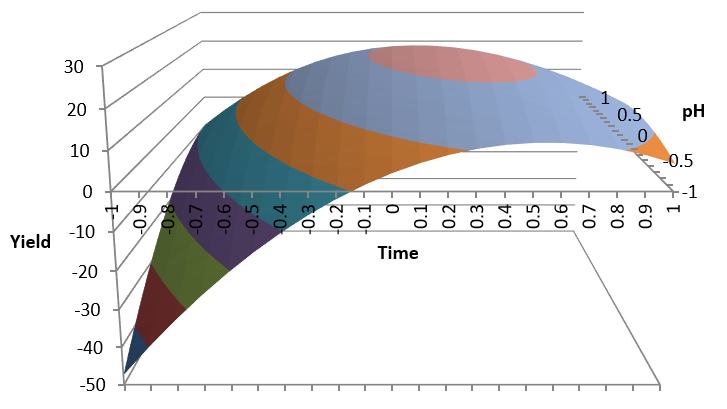
Design of Experiments is a useful methodology for process improvement. The purpose is to find a relationship between process variables we can control and key process outputs in order to increase process capability . You can use Excel statistical analysis tools, Solver, Pivot charts, etc. to plan and analyse the results of these experiments. The first approach is to look for a linear relationship as shown in:   Excel DOE But in some cases this relationship may not be linear, in which case we will try a quadratic model with Response Surface DOE . We will use an example in this Excel file you can download: Download file   ExcelResponseSurface.xlsm   from OneDrive to your PC. In this example we are trying to maximize process yield acting on the critical factors pH , Temperature and Time . We will run the experiments in the Experiments simulation sheet using coded values.   Code pH Temperature Time -1 2 120 7 1 12 150 15 Factorial Experiments We start by running a full factorial experi