Posts

Showing posts with the label DPU

Value Stream Defect Generation and Detection

Image
The quality level seen by the customer of our value stream is one of the most critical process metrics. This quality level is the result of all the defects generated by the different process steps as well as those coming from the parts suppliers.  Ideally defects should not be produced in the first place. Unfortunately the state of the art, in many technologies, is still not there. Therefore, on the mean time, we need process tests and controls to catch and correct defects as soon as they are produced. In our Value Stream Map we focus on process flow but this flow is very much affected by quality.  It is important to find out where in the process each type of defect is generated and where in the process it will be detected to make sure it doesn’t find its way to the customer. Control Plan The Control plan defines all the controls, visual, test, etc., installed along the value stream in order to catch the defects as soon as they are produced in order to correct them and give immediate f

Process Control and Capability

Image
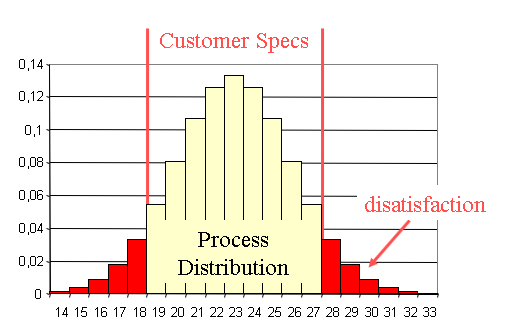
  The first step for process improvement is stability. We analyse this with Statistical Process Control . As a result of this analysis we may find out-of-control situations due to special causes. We need to resolve these causes to make the process stable.  Stability means the process is behaving in a predictable way but it doesn't necessarily mean it meets the customer expectations.  To find out to what extent is the process able to meet the customer expectations we measure Process Capability . Descriptive Statistics with Excel Download a copy of Excel file   Capability.xlsx   from OneDrive on to your PC to run it. In sheet Diameter  we have placed in column A our data consisting of 500 measurements of a critical diameter. After being confident that our process is stable we can characterize it with descriptive statistics in Excel Data Analysis:   These are the results: basic statistics of our data  Frequency Distribution Histogram The histogram gives a graphical representation of