Posts

Showing posts with the label Yield

Response Surface Design Of Experiments with Excel
Image
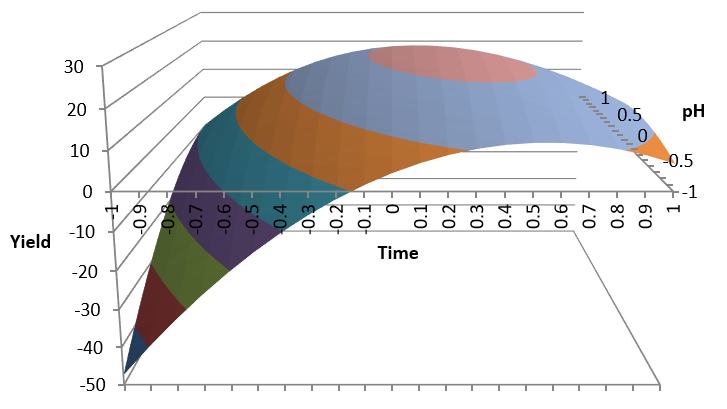
Design of Experiments is a useful methodology for process improvement. The purpose is to find a relationship between process variables we can control and key process outputs in order to increase process capability . You can use Excel statistical analysis tools, Solver, Pivot charts, etc. to plan and analyse the results of these experiments. The first approach is to look for a linear relationship as shown in:   Excel DOE But in some cases this relationship may not be linear, in which case we will try a quadratic model with Response Surface DOE . We will use an example in this Excel file you can download: Download file   ExcelResponseSurface.xlsm   from OneDrive to your PC. In this example we are trying to maximize process yield acting on the critical factors pH , Temperature and Time . We will run the experiments in the Experiments simulation sheet using coded values.   Code pH Temperature Time -1 2 120 7 1 12 150 15 Factorial Experiments We start by running a full factorial experi

Value Stream Defect Generation and Detection

Image
The quality level seen by the customer of our value stream is one of the most critical process metrics. This quality level is the result of all the defects generated by the different process steps as well as those coming from the parts suppliers.  Ideally defects should not be produced in the first place. Unfortunately the state of the art, in many technologies, is still not there. Therefore, on the mean time, we need process tests and controls to catch and correct defects as soon as they are produced. In our Value Stream Map we focus on process flow but this flow is very much affected by quality.  It is important to find out where in the process each type of defect is generated and where in the process it will be detected to make sure it doesn’t find its way to the customer. Control Plan The Control plan defines all the controls, visual, test, etc., installed along the value stream in order to catch the defects as soon as they are produced in order to correct them and give immediate f

Value Stream Data Analysis with Excel

Image
  After we have identified what needs to be improved in our value stream we want to look for the root cause of problems. Due to the existence of variation we will need statistical data analysis. Microsoft Excel provides effective data analysis tools we can effectively use to do this.  The steps for value stream improvement are: Map it as it is really happening today in Gemba with a Value Stream Map . Collect process data in the line. To understand the value stream dynamic behavior we will need statistically significant data to enable simulation   Check for stability with Statistical Process Control Know to what extent it is able to meet the customer requirements with Process Capability Perform additional data analysis to get to the root cause Now we will continue our value stream data analysis both for variables and attribute data. Hypothesis Testing A comparison statement is composed of two hypothesis: Null hypothesis                    H0                   Alternative hypothesis