Posts

Showing posts with the label R square

Simpson's Paradox Analysis with Excel

Image
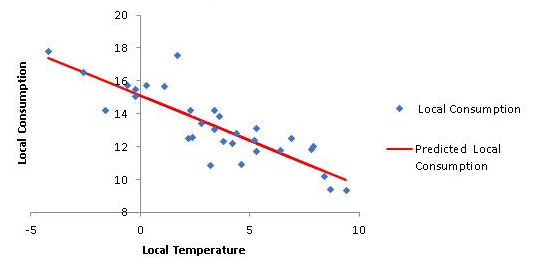
  Probability and Risk: Norman Fenton   Simpson's Paradox is a classic example of a regression misleading interpretation. In this graph, looking at the overall data we see a positive correlation between daily exercise and junk food consumption: the more exercise, the more junk food consumption.  On the other hand looking at the age subgroups it seems the correlation is negative in each one of them.  How could negative correlation of each individual subgroup become positive when subgroups are compounded? This effect when we compound data from several populations is known as Simpson's Paradox. We will analyze this effect with Microsoft Excel. Download Excel file Simpson  from OneDrive to your PC to run this analysis. We have a process described by Y = f ( X ) and we know there is a correlation between input variable X and output Y so we try a linear regression between the two with Excel. We select columns X and Y in the table and select a scatter chart.  We enter a linear trend

Correlation and Regression with Excel

Image
  Correlation is a mutual relationship or connection between two or more continuous variables. Regression is a mathematical model to define that relationship. Process Data Analysis analyzed transfer functions Y = f ( X ) where X was an attribute. Now we will analyze the case of X being a variable. Download Excel file Regression.xlsx from OneDrive to your PC to run the following examples. Correlation We have collected Natural Gas Demand data in sheet Correlation : This is actual daily demand during the month of January and the average local temperature recorded on those days.  From the date time stamp we have computed the day of the week (1 being Monday).  We are looking for factors that may affect demand and two possible factors may be Temperature and DOW. We will use Excel Data Analysis: Correlation Results: We detect a negative ( - 0.85 ) significant correlation between demand and temperature: the lower the temperature the higher the natural gas demand. This is what we would expec