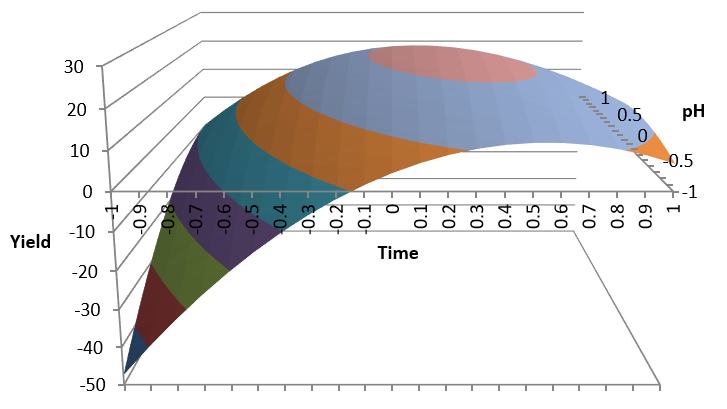
Response Surface Design Of Experiments with Excel

Design of Experiments is a useful methodology for process improvement. The purpose is to find a relationship between process variables we can control and key process outputs in order to increase process capability . You can use Excel statistical analysis tools, Solver, Pivot charts, etc. to plan and analyse the results of these experiments. The first approach is to look for a linear relationship as shown in: Excel DOE But in some cases this relationship may not be linear, in which case we will try a quadratic model with Response Surface DOE . We will use an example in this Excel file you can download: Download file ExcelResponseSurface.xlsm from OneDrive to your PC. In this example we are trying to maximize process yield acting on the critical factors pH , Temperature and Time . We will run the experiments in the Experiments simulation sheet using coded values. Code pH Temperature Time -1 2 120 7 1 12 150 15 Factorial Experiments We start by ru...
