Posts

Random Variation Vs Trends
Image
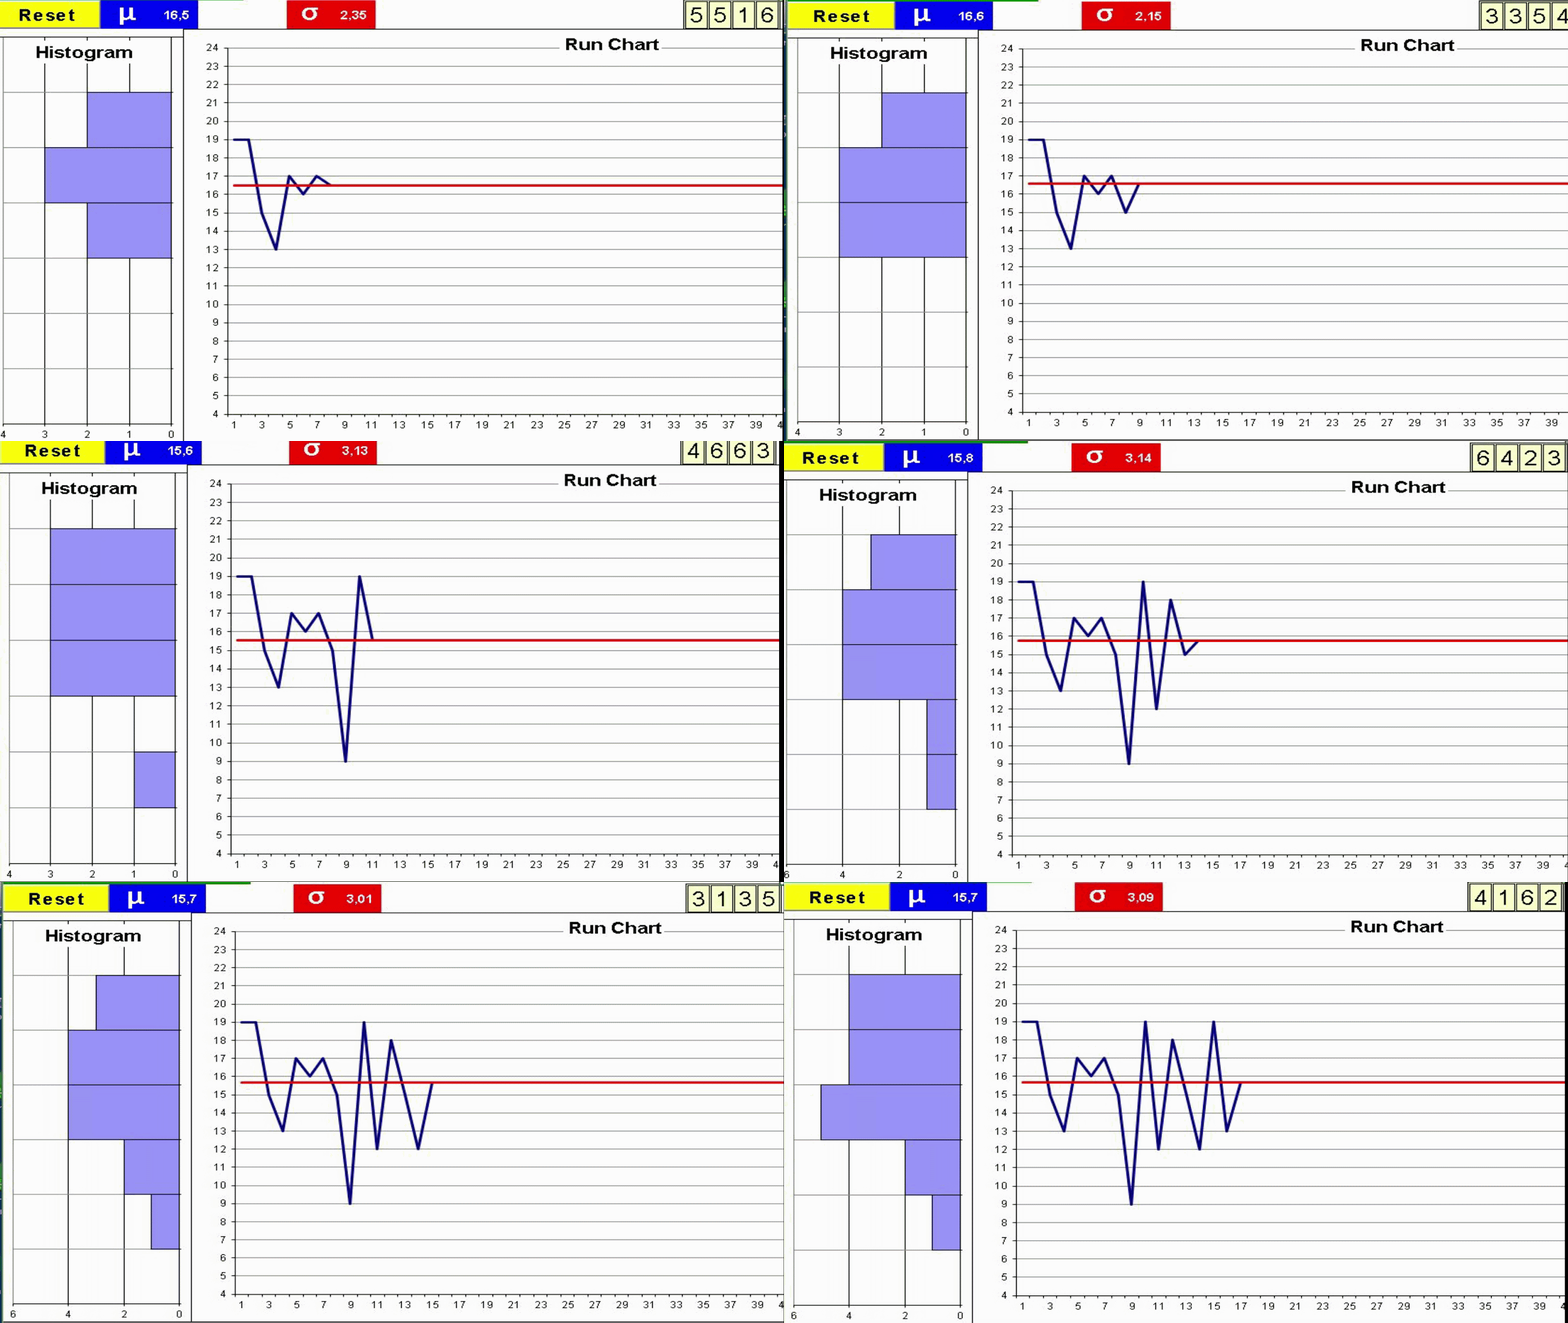
Understanding variation is key to interpret the value stream behavior.  Not all variation is the same. Random Variation Vs Trends: Statistical Process Control     Variation These are some factors which may add variation to the process of cooking a turkey.  Every process has variation. Some causes of variation may be identified and acted upon. We can use two metrics for variation which complement each other: Manual Dice Throwing This simple exercise can help to experience process variation and understand the difference between a process change and inherent process variation. This understanding is key on management decisions to avoid both overreaction and lack of reaction. To run the exercise with actual dice print the form: Exercise: You will need a printed form and 4 dice for each team Throw 4 dice and add the outcomes Record the result in the Run Chart Repeat 50 times Join the dots in the Run Chart with a line Build the Histogram by counting the total number of dots on each group of

Real Time Weight Control with SPC

Image
     Statistical Process Control is used to detect when a significant change has taken place in a process.  We want to detect this change as soon as possible. What is real-time will depend on the process.  All processes have variation as observed in any of their metrics but not all variation is significant from the statistical point of view.  Random Variation Vs Trends: Statistical Process Control When we want to control a process by adjusting some process parameter we can make two mistakes: Over-react by adjusting when we shouldn't Under-react by failing to adjust when we should Control over-reaction A case of over-reaction is illustrated by the following example: Someone is shooting at a target and, based on the deviation of the impacts, he adjusts the gun site after each shot. The end result will be an increase of the dispersion of the impacts, therefore the adjustments will make the process worse. The correct way is, of course, to fire 5 or 6 shots without adjustments and then

Time Variation and Lead Time Increase: A Vicious Circle

Image
Time variation and WIP cause a vicious circle that increases value stream lead time making it difficult to keep pace with changing customer demand. Time is a continuous variable which can be easily recorded without the need of special equipment: PCs or smartphones used to collect data can automatically record a timestamp. When it comes to analyse cause and effect between process parameters and results time is key. Time Variation Causes Accumulation of WIP You can experience this effect in exercise 7 with a simulator  : This WIP Increase Causes a Lead Time Increase As seen in the same simulator: This is due to the fact that items have to wait in the queues formed before steps 2 and 3. Long Lead Times Cause an Amplification Upstream of the Market Variation  This effect is well illustrated in the Beer Game  which can be experienced with various simulators in the web. The game was first described by Peter Senge  in The Fifth Discipline . A small variation in the market demand is amplified