Posts

Natural Gas Demand Forecast

Image
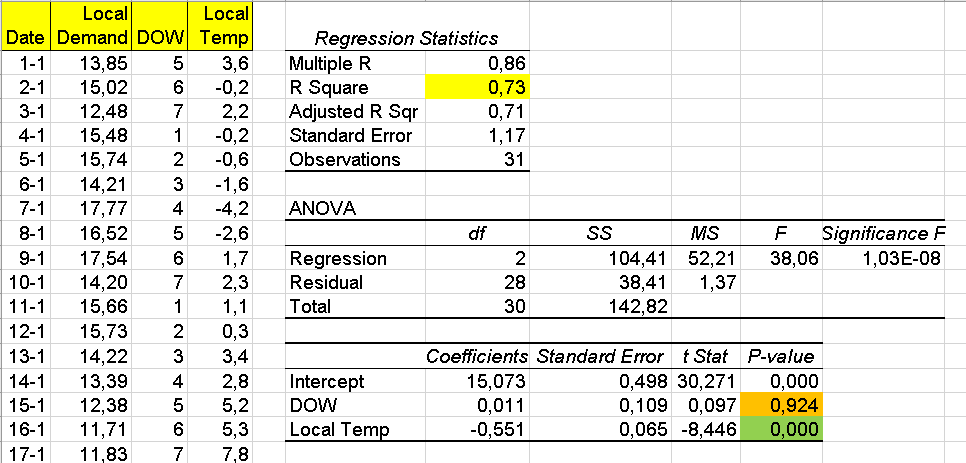
Natural gas demand is highly seasonal, therefore forecasting the final consumption is essential to manage the complete supply chain. Temperature is a main factor affecting home gas consumption for heating. We will analyse the correlation between gas consumption and temperature. Download this Excel file with examples to your PC from OneDrive: Gas Forecast.xlsx   This chart of local consumption during a winter month, leads us to believe that one main factor in consumption is ambient temperature. This may be due to its wide use for heating. We can think of other factors that may affect consumption such as the day of the week so we will analyse this actual consumption data with these two possible factors.  We obtain the day of the week with an Excel formula from the date. We can get the average temperatures of the corresponding geographical area during this period from AEMET (Agencia Estatal de Meteorología) in aemet.es Day of the Week Calculation We obtain the day of the week with this Ex

Multiple Response Optimization with Design of Experiments (DOE)

Image
  Design of experiments, is a systematic experimentation, with a process critical factors, in order to correlate these factors to process responses. In DOE with Excel we obtained a linear relationship, between several factors and one response.  In Response Surface DOE  this was extended to non-linear relations. In both cases we were optimizing one single response. Now we will analyse some cases where more than one response needs to be optimized. Problem Description Download file Multiple Response.xlsm from OneDrive to your PC. We want to maximize yield and minimize cost in a process where we have identified three critical factors which may affect both. These are the factors and levels we want to experiment with: Full Factorial DOE We start with a full factorial with two central points DOE and run a simulation of the experiments in sheet YieldCost Simul  we then add the interaction columns (green headers) for the analysis: We now use Excel Data Analysis > Regression to analyse Y

Six Sigma Virtual Catapult with Excel

Image
  A wooden catapult has been widely used in Six Sigma education to illustrate multiple factor process variation and optimization. We will use a catapult simulator with 4 factors to practice: Process variation Linear regression Response surface analysis Process optimization This will be done using Microsoft Excel Analysis and Solver Download this Excel simulator Catapult.xlsx from One Drive Working Plan 1. What factors affect distance? 2. What values of these factors to achieve maximum distance? 3. Run a full factorial set of experiments with 4 central points 4. Can you detect curvature? Is this linear model valid? 5. Run response surface experiments to find a better model 6. What is the resulting formula to estimate distance as a function of factors? 7. What values give us the maximum distance? 8. Make 10 replicates to estimate the confidence iterval of the distance 9. Calculate the angle a to hit a target of 20 with maximum or minimum values of f, m and l Possible Facto