Posts

The Post-It Paradigm

Image
  Post-Its were introduced in 1977 by the company 3M   and since then they have been used in the whole world in all sort of different areas: home, office, factory, etc. In the area of process improvement they are widely used for: Brainstorming Cause & Effect Diagrams Value Stream Mapping Storyboards Job Scheduling The method used in these work groups is to have participants write their ideas in post-its and stick them on a board or wall for everyone to see. Advantages of this Approach: All participants write at the same time so you can quickly gather inputs from everyone It doesn't require any special skills Post-its can be easily moved or grouped together by the team The overall vision of all these ideas generate new ideas or solutions in the team It enables interactions among the members of the group Some Limitations: The size of the post-it may constrain the description of some ideas Hand writing of the participants may not always be readable by others, specially at a distan

Time: A Key Metric in any Value Stream

Image
  Since 450 BC King Solomon realized the importance of the right time for everything.   Time is often critical to our success in daily life. Following the right sequence of the different activities is also key. Time is critical to any process, whether it be manufacturing, sales, distribution or business processes. Value Stream Map : Who Does What and When When several people are involved in a sequential process each one needs to know when he needs to do something. Synchronization is key for success. A value stream map defines the right sequence of activities and who does what.  Job Scheduling In addition to defining the sequence of operations we should be able to plan when each one is involved therefore we need to know the time each job it will take.  In a sequential process a delay in one of the steps causes a delay to all following steps so this requires a reschedule of the value stream and a quick communication to all those involved in order to react. Time Measurement Time is a var

Learn by Doing

Image
Learn by doing , although it takes longer, it is usually worth it. The Socratic method helps students find solutions for themselves rather than just being told. Group exercises and simulations are practical ways to implement this methodology. In most value streams the delay between actions and effects is long (sometimes months) so it is difficult to associate results to some action we took in the past. Simulation reduces this delay from months to minutes so this allows us to try different solutions and experience the results and any side effects our actions may produce. These are some successful group exercises and simulators: The Beer Game This is a group exercise which has been described by Peter Senge in The Fifth Discipline   It is very popular in management courses and it is a good example of learning by doing . It simulates a beer supply chain from the factory to the final customer.  The objective is to meet the customer demand for a number of weeks keeping the minimum inventory

Virtual Obeya Room

Image
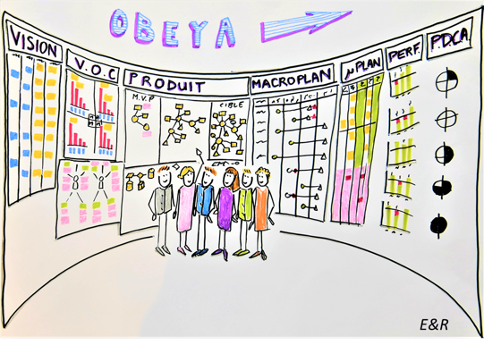
The Obeya room is a "war room" used by process improvement teams to meet and solve critical multi functional problems.  The room walls are lined up with boards, highly visual charts and graphs showing program timing, milestones and progress to date and countermeasures to existing timing or technical problems.  The team meets in this room regularly but team members can also visit the room, which is fully dedicated to the project, throughout the day. Obeya Room Benefits Remove organizational barriers Visual management by displaying all relevant data required in the improvement project Encourage a collaborative environment through regular meetings Implement quicker, more effective solutions The whole team knows what is going on in real time Some Practical Constraints in the Implementation Some companies can't afford the luxury of a fully dedicated room Some of the team members may be located far away so they will only attend the meetings The data displayed on the walls may,

Random Variation Vs Trends

Image
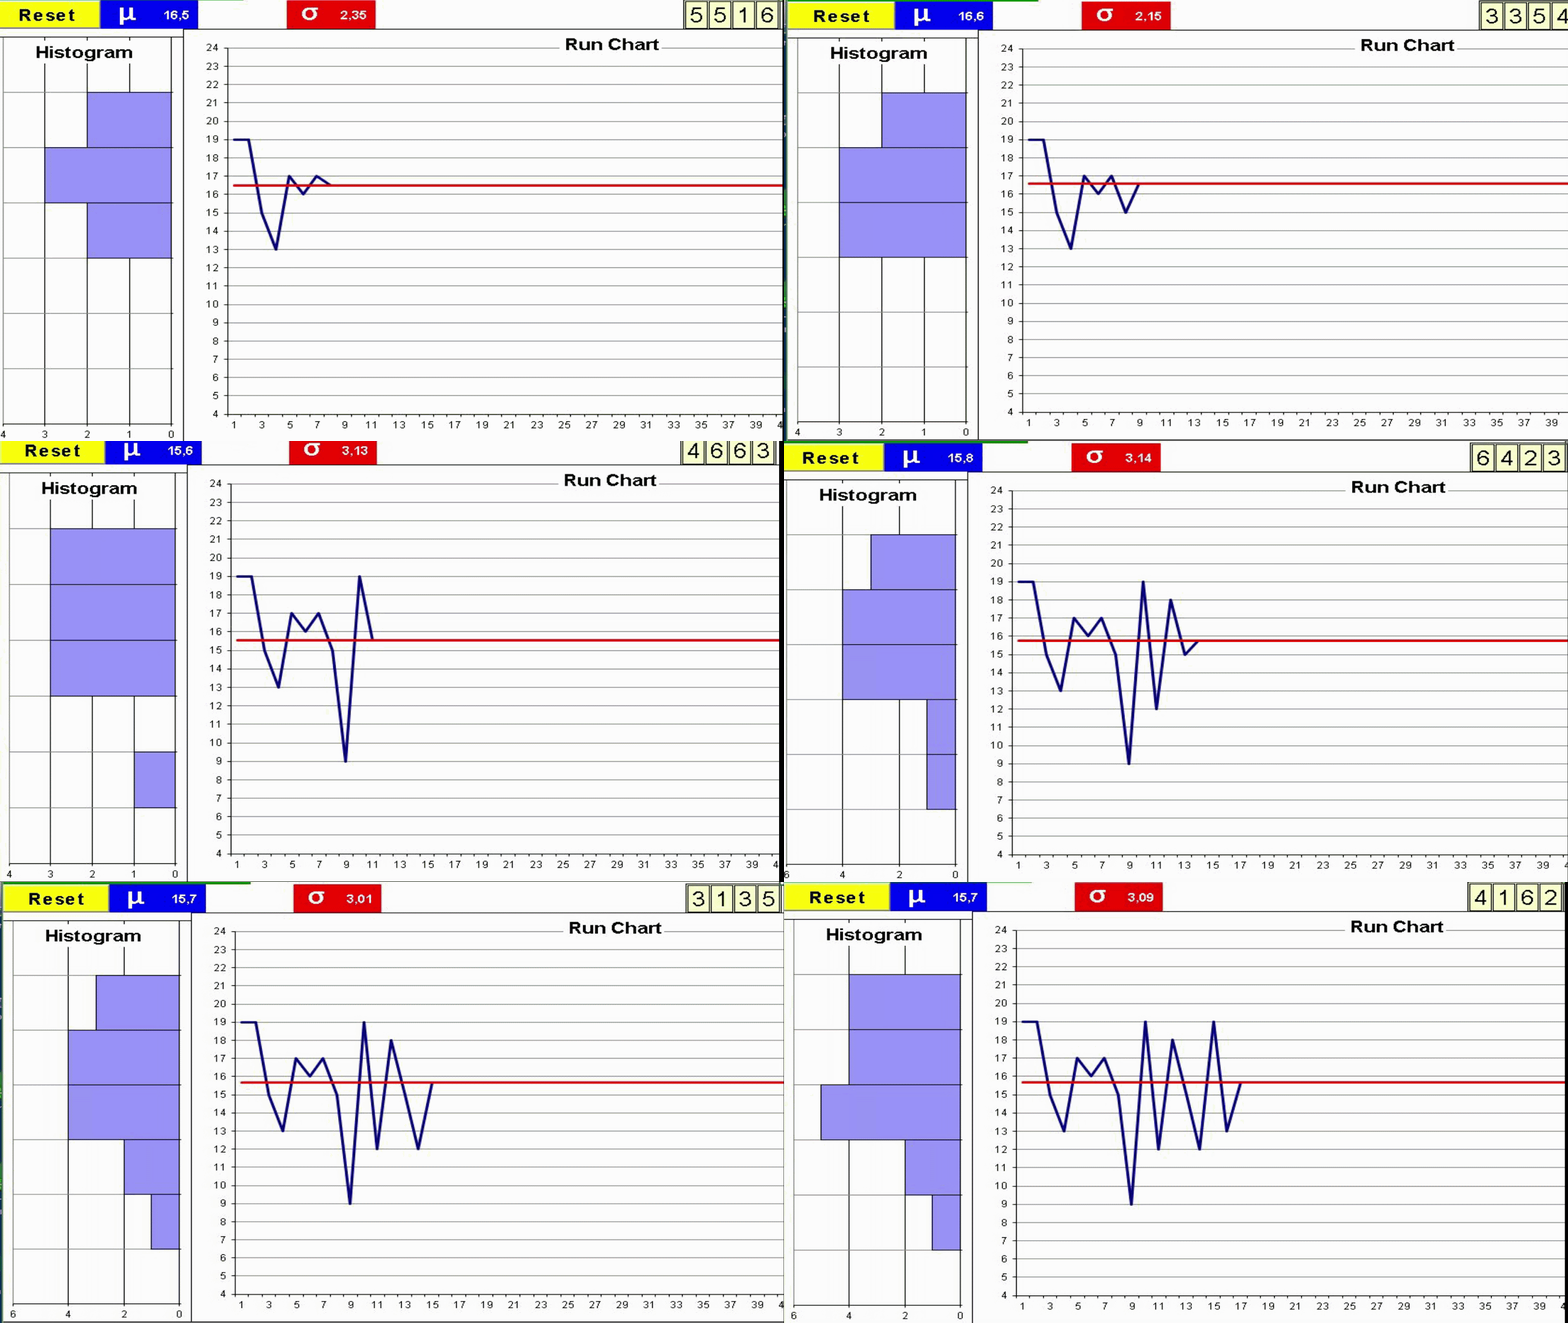
Understanding variation is key to interpret the value stream behavior.  Not all variation is the same. Random Variation Vs Trends: Statistical Process Control     Variation These are some factors which may add variation to the process of cooking a turkey.  Every process has variation. Some causes of variation may be identified and acted upon. We can use two metrics for variation which complement each other: Manual Dice Throwing This simple exercise can help to experience process variation and understand the difference between a process change and inherent process variation. This understanding is key on management decisions to avoid both overreaction and lack of reaction. To run the exercise with actual dice print the form: Exercise: You will need a printed form and 4 dice for each team Throw 4 dice and add the outcomes Record the result in the Run Chart Repeat 50 times Join the dots in the Run Chart with a line Build the Histogram by counting the total number of dots on each group of