Posts

Theory of Constraints with Excel Solver

Image
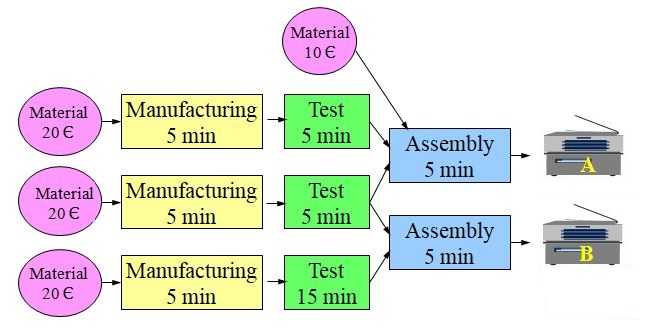
  The Theory of Constraints is a process improvement methodology that emphasizes the importance of identifying the " system constraint " or bottleneck. By leveraging this constraint, organizations can achieve their financial goals while delivering on-time-in-full to customers, avoiding stock-outs in the supply chain, reducing lead time, etc. Manufacturing Process Example With this simple value stream above, to produce products A and B, we want to illustrate the way to maximize profit taking into account the system constraints . Each product is made by assembling two sub assemblies, one of them common to both products. The process consists of three sequential operations for which there are special purpose workstations with a corresponding operator each trained for the specific job: Manufacturing Test Assembly We want to know how many products A and how many B we should produce to maximize profit. System Constraints Product Margin We want to maximize overall profit so we calcu

Value Stream Defect Generation and Detection

Image
The quality level seen by the customer of our value stream is one of the most critical process metrics. This quality level is the result of all the defects generated by the different process steps as well as those coming from the parts suppliers.  Ideally defects should not be produced in the first place. Unfortunately the state of the art, in many technologies, is still not there. Therefore, on the mean time, we need process tests and controls to catch and correct defects as soon as they are produced. In our Value Stream Map we focus on process flow but this flow is very much affected by quality.  It is important to find out where in the process each type of defect is generated and where in the process it will be detected to make sure it doesn’t find its way to the customer. Control Plan The Control plan defines all the controls, visual, test, etc., installed along the value stream in order to catch the defects as soon as they are produced in order to correct them and give immediate f

Simpson's Paradox Analysis with Excel

Image
  Probability and Risk: Norman Fenton   Simpson's Paradox is a classic example of a regression misleading interpretation. In this graph, looking at the overall data we see a positive correlation between daily exercise and junk food consumption: the more exercise, the more junk food consumption.  On the other hand looking at the age subgroups it seems the correlation is negative in each one of them.  How could negative correlation of each individual subgroup become positive when subgroups are compounded? This effect when we compound data from several populations is known as Simpson's Paradox. We will analyze this effect with Microsoft Excel. Download Excel file Simpson  from OneDrive to your PC to run this analysis. We have a process described by Y = f ( X ) and we know there is a correlation between input variable X and output Y so we try a linear regression between the two with Excel. We select columns X and Y in the table and select a scatter chart.  We enter a linear trend

Correlation and Regression with Excel

Image
  Correlation is a mutual relationship or connection between two or more continuous variables. Regression is a mathematical model to define that relationship. Process Data Analysis analyzed transfer functions Y = f ( X ) where X was an attribute. Now we will analyze the case of X being a variable. Download Excel file Regression.xlsx from OneDrive to your PC to run the following examples. Correlation We have collected Natural Gas Demand data in sheet Correlation : This is actual daily demand during the month of January and the average local temperature recorded on those days.  From the date time stamp we have computed the day of the week (1 being Monday).  We are looking for factors that may affect demand and two possible factors may be Temperature and DOW. We will use Excel Data Analysis: Correlation Results: We detect a negative ( - 0.85 ) significant correlation between demand and temperature: the lower the temperature the higher the natural gas demand. This is what we would expec